

Technopedia defines Big Data as being, “a process that is used when traditional data mining and handling techniques cannot uncover the insights and meaning of the underlying data.” This indicates that Big Data is not just a massive quantity of data; it also involves the processes required to turn that data into useful information. This type of data requires a different processing approach from what we have used in the past.
Not only has more data been generated over time, but there have also been new types of data created. Initially, businesses focused on processing structured data, for example, the types that you could store in a text file or spreadsheet. But nowadays, much data is unstructured – and these aren’t always obvious. For example, although predominantly text-based, emails aren’t in a form that traditional data mining tools can access and make sense of. And think nowadays, how much data exists as audio, video, and image files.
The Internet of Things has expanded the collection of data even wider, for example, think about everything the sensors on your phone, or even Fitbit, record and collect.
Recent expansions in the capabilities and availability of facial and voice recognition contribute vast amounts of data and these require Big Data processing capabilities to have any value.
The advent of Big Data has led to an increase in demand for ways to process it efficiently and cost-effectively. Otherwise collecting that data becomes pointless and a massive waste of resources. You need a way to scan huge quantities of data to look for patterns or connections, that you can then use in your strategic planning.
Data scientists describe Big Data in terms of the 3Vs:
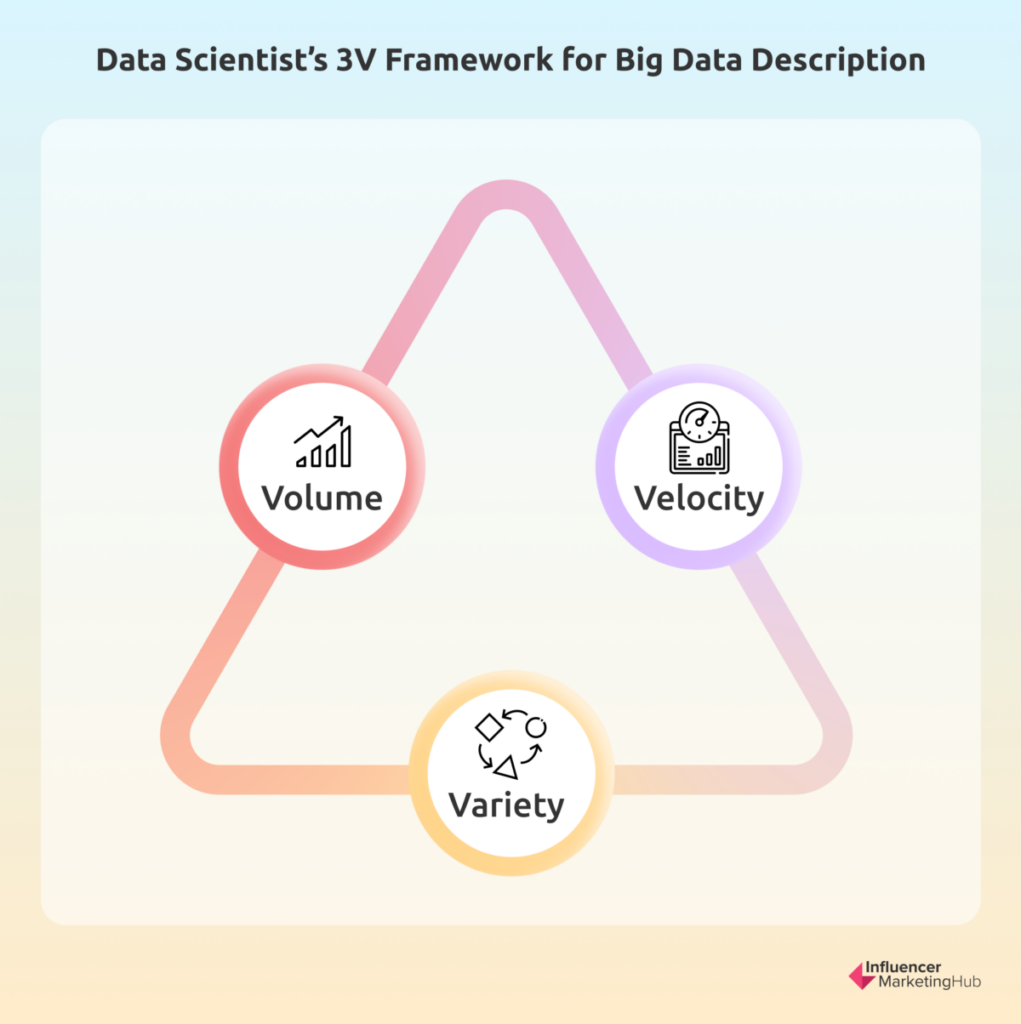
Volume – the quantity of data generated from various sources
Velocity – the speed of generated data
Variety – the mix of data types included in the overall collection of data – structured / semi-structured / unstructured.
Any data analysis system must take the 3Vs of the data it handles into account, particularly when determining its capabilities.
What is Data Analysis?
Data analysis is the process of studying data and drawing patterns. It is at the hub of the field of data analytics. Data analysis includes both descriptive analysis (analyzing data and describing what’s happening) and predictive analysis (predicting what will happen in the future, based on current and past activities).
Many businesses struggle to access all the data relating to their business. Often, suitable data is readily available, but the business lacks tools to analyze it into a usable form. The data may be scattered across many places, meaning that a business first needs to gather all the necessary data before they even begin data analysis. And then once a firm has collected data from a range of sources, they often need to convert it into a common form and merge it. This can be as simple as being able to compare data in .CSV and Excel file formats.
Oracle observes that the data gathering process can be much more difficult and time-consuming than the actual data analysis, particularly where it’s manual and non-repeatable. Typically, firms have to “reinvent the wheel” every time they need to carry out this data analysis.
There are four main types of data analytics, according to Gartner’s Ascendency Model:
1. Descriptive data analytics – addresses basic questions like “how many, when, where, and what.” These are the focus of business intelligence (BI) tools and dashboards. Descriptive analytics can be further separated into ad hoc reporting (custom reports generated for you as and when required) and canned reports (scheduled reports following a template or common format). [What Happened?]
2. Diagnostic data analytics – the process of examining data to understand the cause and effect or why something happened. [Why did it happen?]
3. Predictive data analytics – you can use these to identify trends, correlations, and causation. These can include both predictive modeling and statistical modeling. [What will happen?]
4. Prescriptive data analytics – where AI and big data combine to help predict outcomes and identify what actions to take. [How can we make it happen?]
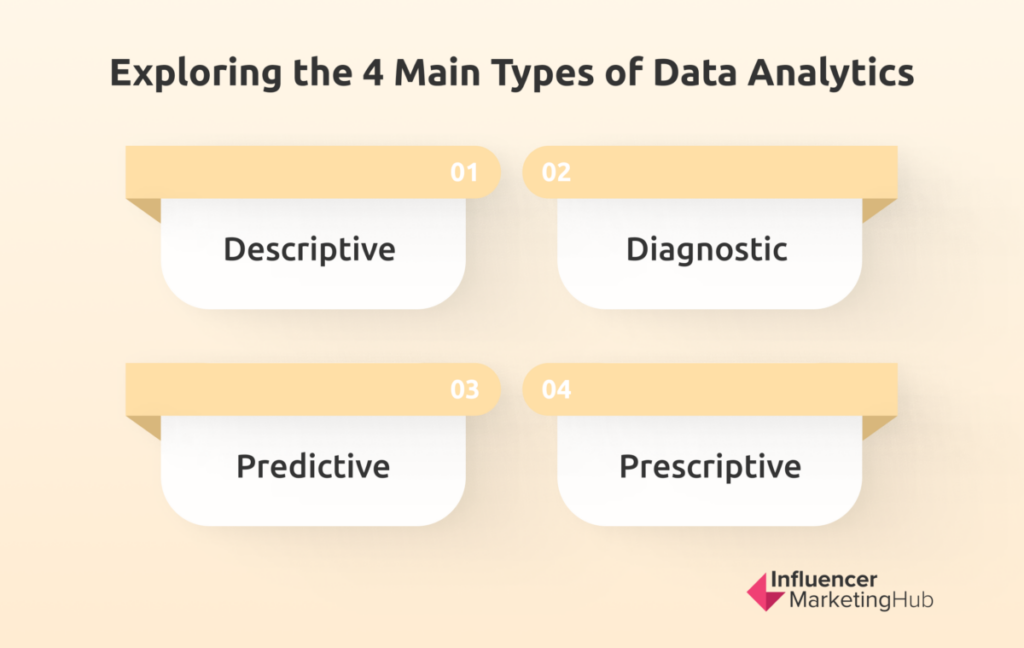
Each of these types of data analysis has a specific purpose, with some focusing on the future, and others on better understanding the past. No matter which type best suits your needs, however, the primary goal of a data analyst is to use data to increase efficiency and improve performance, by finding patterns in data.
Seven technologies encompass data analytics and Big Data:
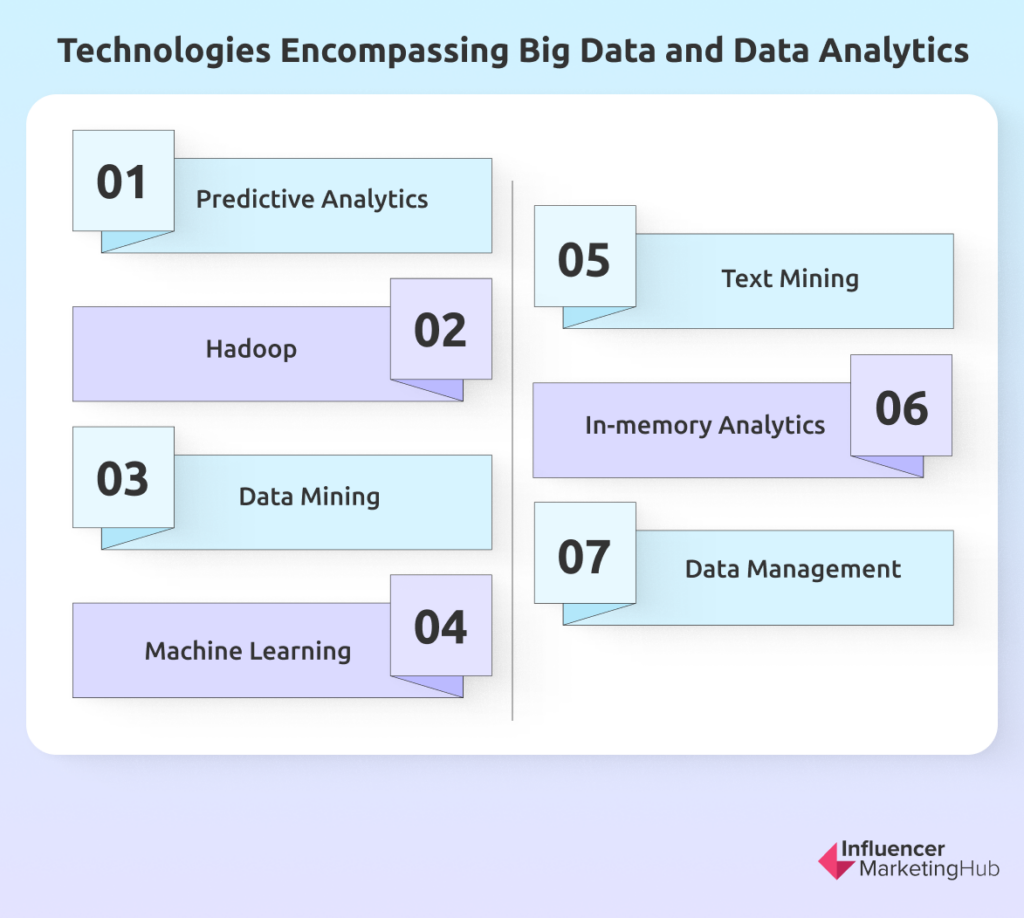
- Predictive Analytics – statistical algorithms working on data that determine future results based on historical data
- Hadoop – a software framework capable of processing and containing vast levels of data
- Data Mining – analysis of vast quantities of data to uncover connections and patterns
- Machine Learning – that part of AI that involves programming computers to learn from experience, so they can generate models to analyze large data sets and produce better, more refined results.
- Text Mining – like Data Mining, but aiming to analyze available text to develop insights and understanding – closely associated with Natural Language Processing (NLP)
- In-memory Analytics – analysis of system memory data to gain insight
- Data Management – improving the storage, quality, and organization of data in organizations.
Using AI for Data Analysis
As we saw in What is AI Marketing?, the emergence of AI has caused a seismic shift that has transformed the marketing industry beyond recognition. One of the reasons for this is the power of AI to speed up and make sense of data analysis. AI has given marketers the ability to harness vast quantities of data, automate complex processes, personalize content, and make predictions with previously unheralded accuracy.
AI uses computing devices to simulate human intelligence processes. It generally takes large sums of training data, “learns” from this, and then analyzes live data for correlations and patterns, making predictions about what this means for the future.
Traditional data analysis requires considerable human input to manipulate code every time somebody needs a change made. AI, however, removes this requirement, as it can make the necessary adjustments independently, particularly if it incorporates machine learning.
AI can encompass all seven of the technologies we referred to above to make the processing of Big Data possible and manageable.
Related Content:
- Artificial Intelligence (AI) Marketing Benchmark Report: 2023
- The Ultimate Guide to AI Marketing in 2023
- How a Customer Data Platform Can Transform Your Business Strategy
How Does AI Data Analysis Differ from Traditional Data Analysis
The main differences between AI and traditional data analysis relate to capacity and computer independence. We had previously hit a limit on the quantity of data that humans could efficiently process. To go any further into data analysis typically required so many resources that it quickly became impractical and uneconomical. AI-based systems can handle substantially more data thrown at them and work at superhuman speed to achieve better results.
Also, systems that include machine learning, allow computers to learn and work independently, turning disparate forms of raw data into meaningful analyses. These systems need human input at the beginning, but before long they can function independently, leaving staff to do other higher-priority tasks.
Uses for AI Data Analytics
Machine learning gives opportunities for businesses to process massive quantities of data and discover trends and patterns. This offers them the chance to optimize systems and provide personalized service to their customers.
Businesses can obtain data from a wide variety of sources. They can even use facial detection and recognition software to personalize marketing to individuals. Intelligent automation software can learn from the emotional reactions consumers display, and the software can adapt its marketing messages accordingly. Firms can improve customer service, and in turn, the customer experience, by combining historical customer data, complex algorithms, natural language processing, and even emotional analysis to better predict customer wishes.
Walmart, for instance, uses artificial intelligence models to better predict the optimal inventory mix for any store on a given day. For example, they feed weather information into their systems so that they can adopt store stock to reflect customer demand better. They know that a store in an area where a hurricane is forecast will have increased demand for things like sandbags, bottled water, and wet/dry vacuums. Walmart knows to rush ship these items from their distribution centers to that store. The more weather events there are, the more the system learns customer demands.
Another case where Walmart adapts in real-time to its data analytics is with AI smart pricing. They are experimenting with Wi-Fi-enabled cameras with real-time data in the meat aisles, adapting prices to reduce spoilage and waste. Walmart has found that this smart pricing has led to a 30% sales boost in the department.
How Can AI be Used to Uncover Insights and Trends from Customer Data?
As Deeper Insights observes, AI can revolutionize the way we gather product and consumer insights. Businesses can leverage the power of unstructured data analytics to track consumer behavior such as buying patterns or finding unmet needs in a crowded product category. It can assist businesses to innovate, expand, upsell, and cross-sell their products and services to markets previously unthought of.
Unstructured data, such as reviews, comments, social media posts, and forums, can truly capture the views of your customers. Yet this data would previously have been excluded from your business decision-making, most likely placed in the “too hard” category. These give brands a deeper understanding of customer behaviors and hidden opportunities.
Text analytics can give insight into customer sentiment, conversation trends, discussed topics, and other helpful information. AI-powered text analytics provides predictive analysis capabilities allowing businesses to anticipate customer needs and market trends better.
Predictive and prescriptive data analytics help you determine what customers want before they do. This ensures you can order the right types and quantities of inventory with little wastage, improve customer service, maximize business efficiency, and increase your customer lifetime value.
There are multiple tools to visualize, analyze, and keep track of your data, allowing you to get the insights you need to achieve your goals. But, with so many tools to choose from, how do you know which one is the right for you? Let’s find out.
Data analysis is more important than ever. And, if you’re not a professional data analyst (and maybe even if you are), you need the right AI tools to analyze data.
There are multiple tools to visualize, analyze, and keep track of your data, allowing you to get the insights you need to achieve your goals. But, with so many tools to choose from, how do you know which one is the right for you?
What can AI tools do for you and your data exactly?
Let’s dive in.
How Is AI Used in Analytics?
With AI becoming more and more advanced every day, AI is becoming a more powerful, efficient, and approachable solution to process data.
Some of the modern ways of using AI in Analytics are:
- Finding insights: AI can examine vast amounts of data and find the trends and patterns needed to help users find the insights needed to improve their sales and marketing efforts, customer interactions, engagement, and more.
- Streamline data analysis: By funneling all data into one solution, users can gain a more complete overview of their data and make it easy to understand and keep track of.
- Predict outcomes: With Predictive AI, users can develop forecasts and analyze potential scenarios to determine the one with the better chances of success.
What’s more, practically no other alternative can be used to solve all the issues AI does, or to analyze data in a more efficient and insightful way.
The Relationship Between AI and Data Analysis
The advent of artificial intelligence (AI) has revolutionized the way we approach data analysis. Traditional methods of data analysis required manual effort and time to derive insights from vast datasets. With AI data analysis, this process is expedited, allowing for real-time insights and predictive capabilities. AI algorithms can sift through massive amounts of data, identifying patterns, anomalies, and trends that might go unnoticed by human analysts.
Moreover, data analysis AI tools bring a level of consistency and accuracy that’s hard to achieve manually. By leveraging machine learning and deep learning models, AI data analytics can adapt and learn from new data, continuously refining its analysis methods and ensuring up-to-date insights.
The Future of Data Analysis: Entwined with AI
As we venture further into the digital age, the symbiotic relationship between AI and data analysis will only deepen. The future of ai data analytics is not just about faster computations but about smarter and more intuitive analytics.
Predictive analytics, sentiment analysis, and real-time data processing are just the tip of the iceberg. In the near future, we can expect AI-driven tools to become even more sophisticated, offering capabilities like emotion detection, real-time anomaly detection, and even prescriptive analytics that can suggest actions based on the data analysis.
Moreover, as businesses and organizations generate more data, the demand for AI-enhanced data analysis tools will surge. Integrating AI into data analysis workflows will soon become the norm rather than the exception.
In conclusion, as AI continues to evolve and integrate deeper into the realm of data analysis, businesses and individuals must adapt and harness these powerful tools to stay ahead in an increasingly data-driven world.
Why should you use AI for your Data Analysis?
So, you already have access to your website’s analytics or the data of your marketing efforts, what can AI do for you?
With AI, you can make sure you’re analyzing all data uniformly. Since AI lacks human bias and can examine vast amounts of data at lightning-fast speed, it can predict how your campaigns will go, and even proactively offer insights to ensure you’re catching all info.
This allows you to examine and keep track of your data even if you’re not a data scientist. After all, with AI products, you can skip the long and expensive process of developing algorithms, and skip right to analyzing your data.
The best 10 AI tools to analyze data
Here are some of the best AI tools to analyze data:
1. Polymer
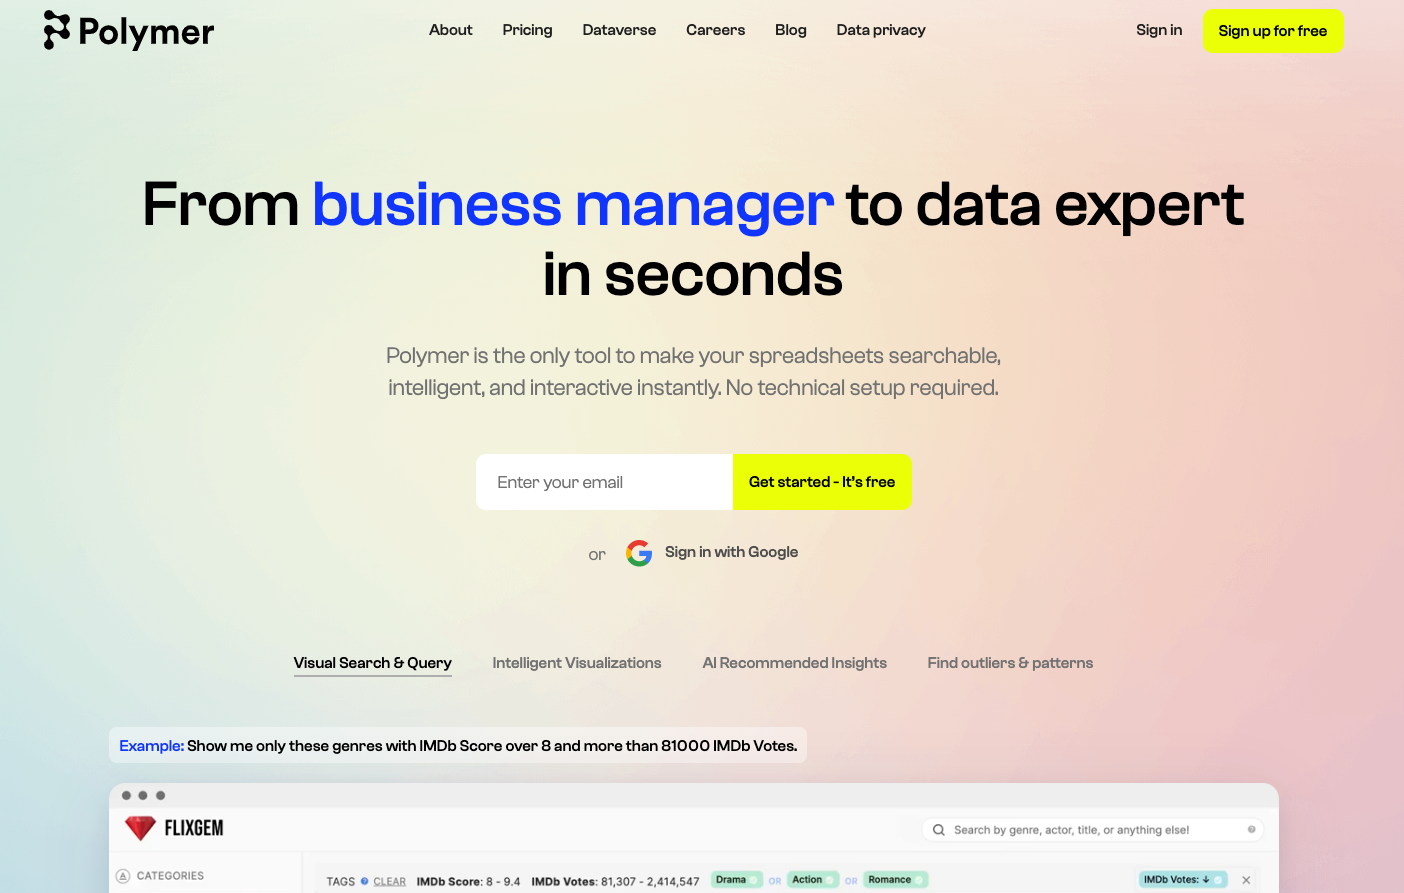
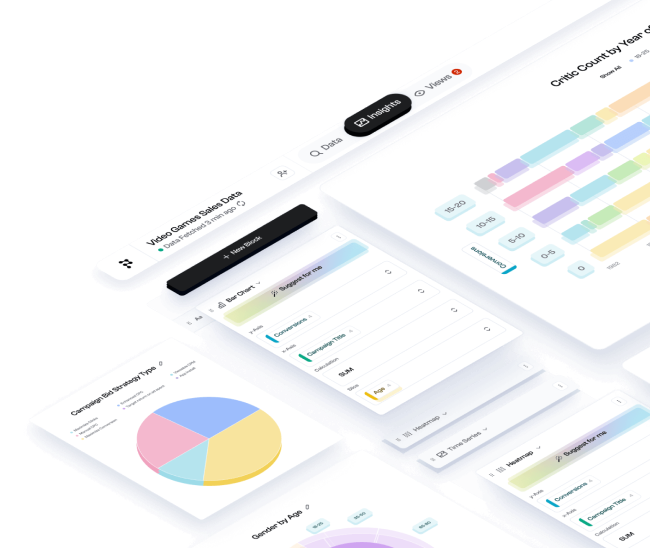
Polymer Search is a robust tool with a powerful AI made to turn your boring data into a more streamlined, powerful, and flexible database. All without writing a single line of code.
Polymer powers your spreadsheet with a robust AI, to help you analyze your data and improve your understanding of it, all with a few clicks. There’s no long onboarding process or training videos to go through. Simply upload your spreadsheet to Polymer and instantly transform it into a streamlined database easy to explore.
Simply sign in to your free Polymer account, and upload your spreadsheet or share it from the cloud. Polymer Search will then use its AI to encrypt and analyze your data, transforming it into a powerful web app that’s easy to analyze and search through.
You can further customize the web app with multiple layouts at any time, getting the one that better fits your current needs. You can also use the “Smart Pivot” tool to use as a powerful and improved pivot table.
Polymer is the simplest way of using AI to analyze your data, while offering you intuitive visualization capabilities and almost limitless ways of interacting with your data.
Drop your first spreadsheet and try it yourself.
.svg)
Understand your data through AI.
Polymer makes data analysis quick and easy with AI-driven insights and interactive dashboards.
2. Tableau
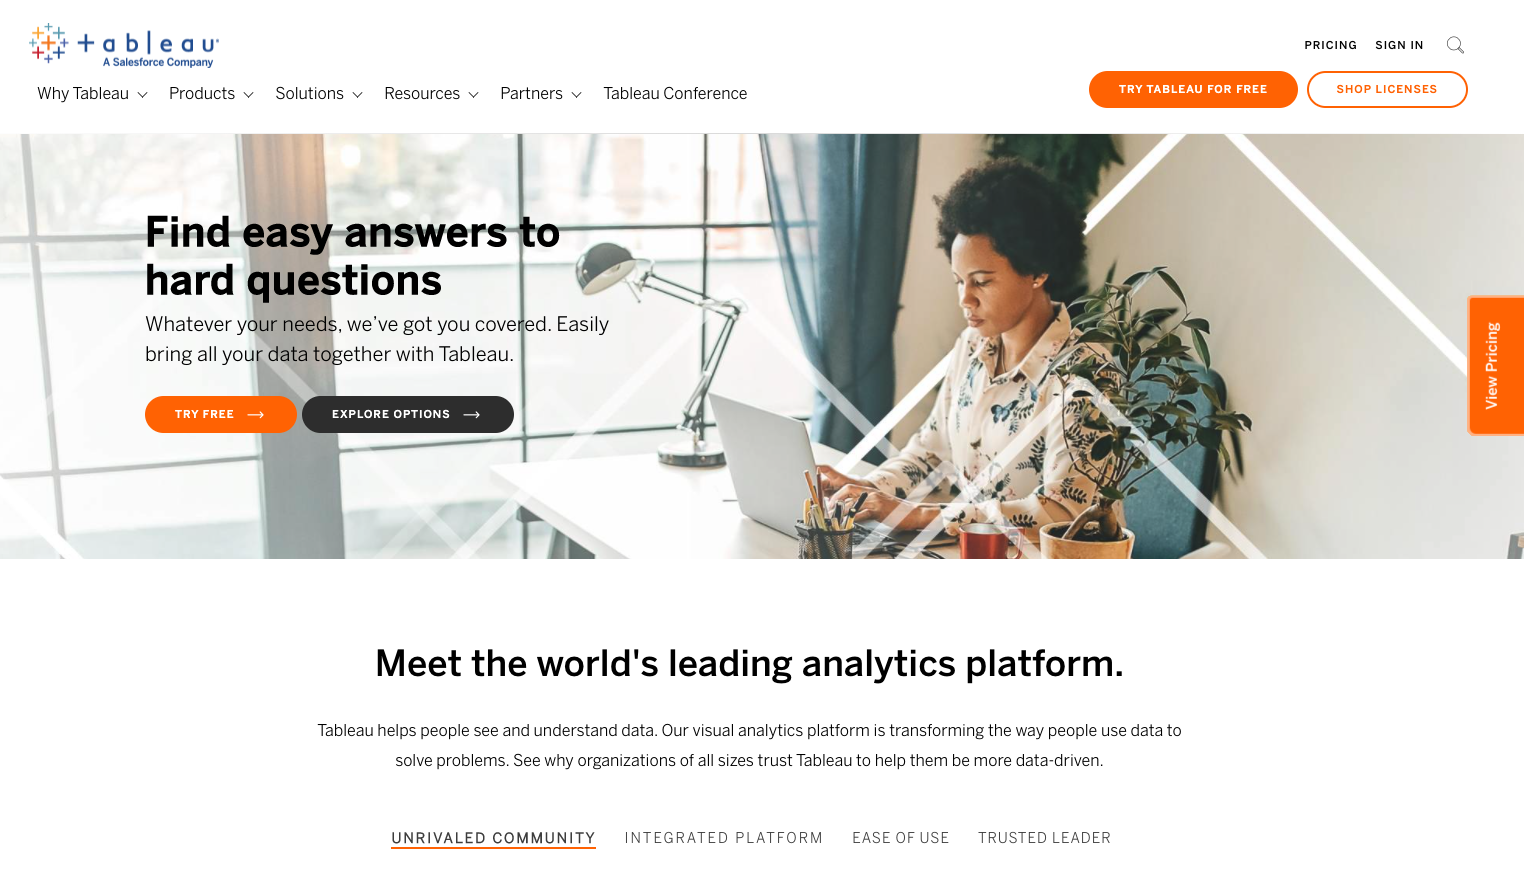
Tableau is an analytics and data visualization platform that allows users to interact with the data they have without the need for coding.
The platform is easy to use, allowing users to create and modify dashboards and reports in real-time, and seamlessly share them across users and teams. It comes with all the features expected from tools like these, supporting databases of all sizes and offering multiple visualization options for users to analyze their data.
Tableau also allows users to run the platform both in the cloud or on-premise for users looking for a more hermetic environment for their data.
3. MonkeyLearn
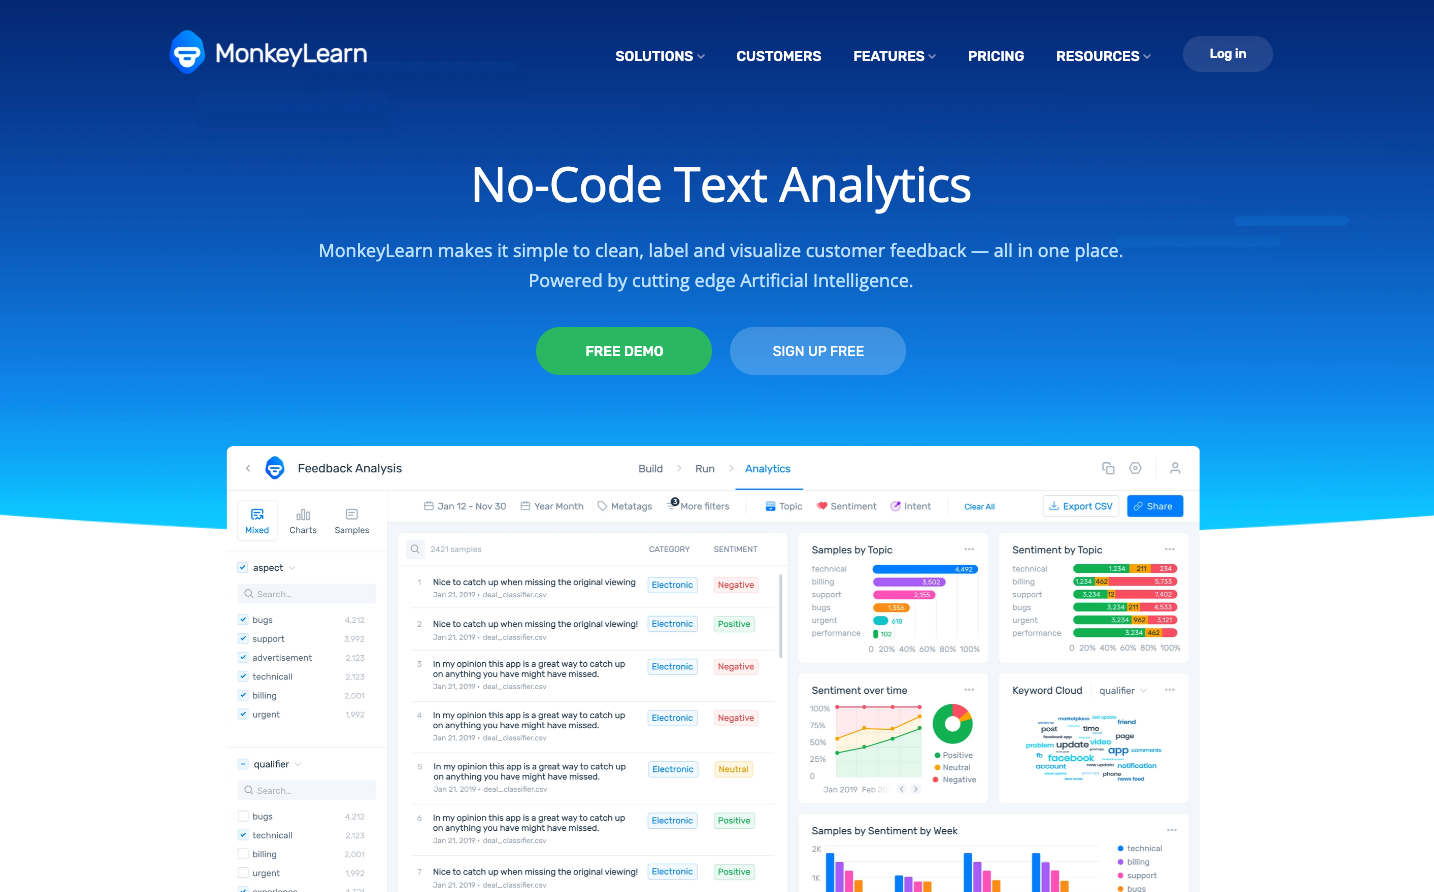
MonkeyLearn is another no-coding platform with AI data analysis features for users to visualize and rearrange their data.
The platform comes with multiple AI-powered text analysis tools to instantly analyze and visualize data to the user’s needs. Users can set up text classifiers and text extractors to automatically sort data according to the right topic or intent, and extract product features or user data.
The tool comes with multiple integrations to work with whichever tools are already being used, and a simple and intuitive UI matching the simplicity of the platform.
4. Microsoft Power BI

Microsoft Power BI is a famous business intelligence platform that also gives users the ability to sort through their data and visualize it to search for insight.
The platform allows users to import data from practically anywhere, and get started on creating reports and dashboards as they need. Users can also build machine learning models and access other AI-powered features to help them analize their data.
The platform comes with multiple integrations, including a native Excel integration, and a UI faster and more responsive than some other solutions, although often at a higher price tag.
5. Sisense
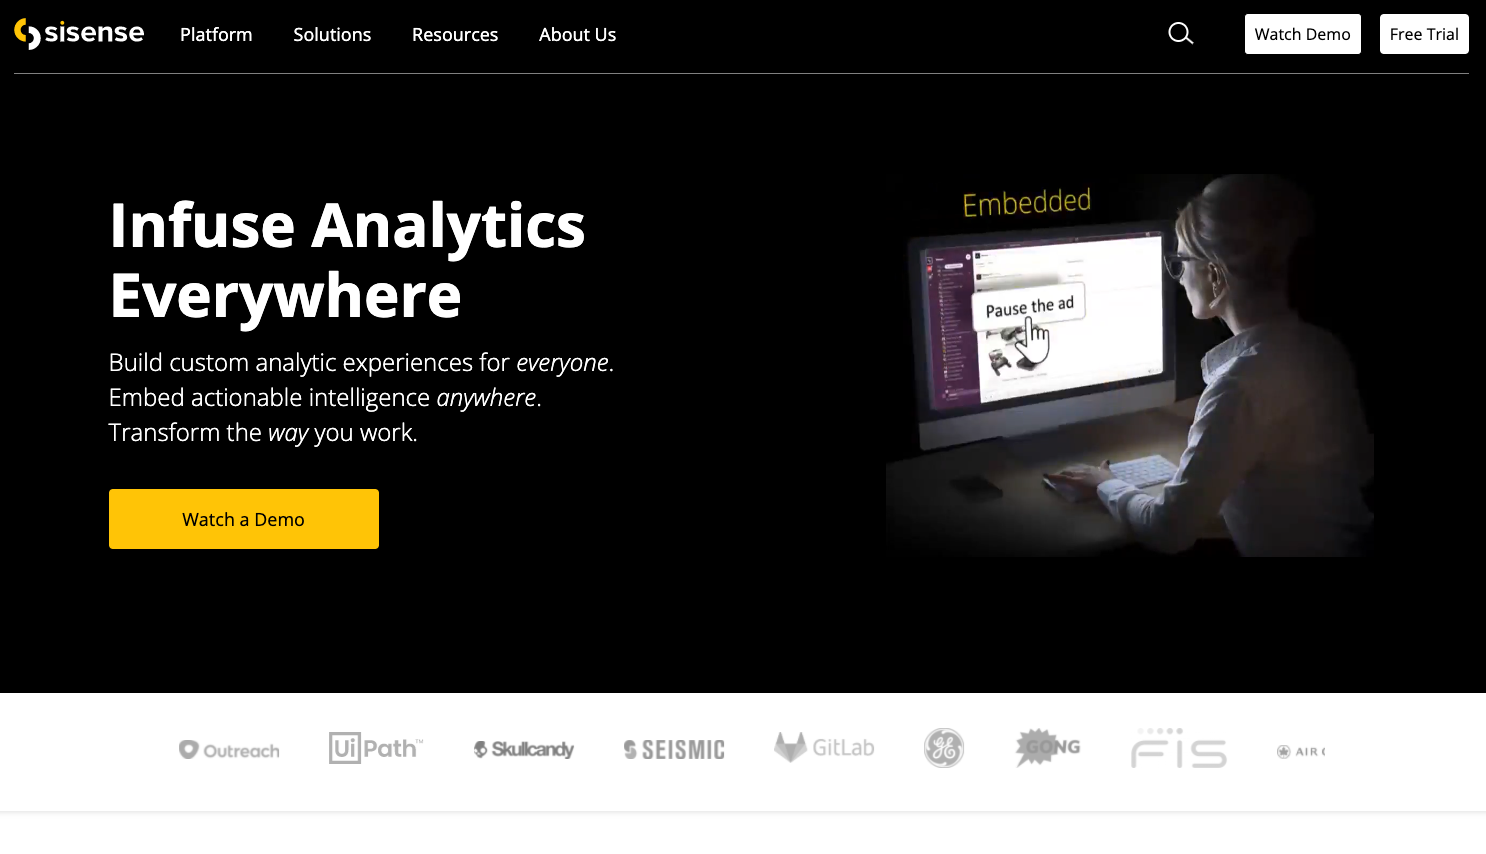
Sisense is another data analytics platform that allows both analysts and developers to sort through and visualize their data.
The platform is easy to use, with multiple drag-and-drop tools and a responsive UI made to streamline the experience. Sisense also allows users to access their “In-Chip” technology and choose between RAM and CPU to process the data, making computation faster when handling large datasets.
Although the platform has limited visualization capabilities, it’s a good option for users with basic visualization and reporting needs looking to handle smaller datasets.
6. Microsoft Excel
Microsoft Excel was the best data analysis tool when it was created, and remains a competitive one today.
With Excel’s Data Analysis Toolpak, users can analyze and process their data, create multiple basic visualizations, and quickly filter through data with the help of search boxes and pivot tables. Excel also allows users to create machine learning models with no coding, use formulas to calculate data from clusters, and even create complex neural networks.
Although Excel’s capabilities have kept up with the times, it remains limited by its spreadsheet model and high learning curve, even without the need to code.
7. Akkio
Akkio is a business analytics and forecasting tool for users to analyze their data and predict potential outcomes.
This no-coding platform comes with lead scoring features made for users to qualify and segment their lead lists and prioritize hot leads. The forecasting features allow users to use the data they have to get future predictions on practically any dataset.
The tool is fast and intuitive, and comes with few but useful integrations to get data to and from other tools.
8. Qlik
QlikView is another business intelligence and data visualization solution that allows users to tap into AI technology to analyze their data.
The platform comes with multiple data exploration features and a versatile platform that’s friendly to both technical and non-technical users. Teams can seamlessly collaborate on the platform using simple drag-and-drop editors and workflows to manipulate their data to their liking.
Although the platform is highly functional, the high cost and comparatively low AI feature set make QlikView a better choice only for users who can use the full extent of the platform.
9. Looker
Part of the Google Cloud, Looker is another no-code data analysis and business intelligence tool with powerful capabilities and multiple integrations.
Looker is capable of processing large databases, allowing users to make multiple dashboards and reports, and condensing all their data sources into one. The platform is also capable of advanced data modeling features and comes with the benefit of being backed by Google.
Although the platform is easy to navigate, it doesn’t provide a lot of flexibility, and building reports from scratch can be time-consuming.
10. SAP BusinessObjects
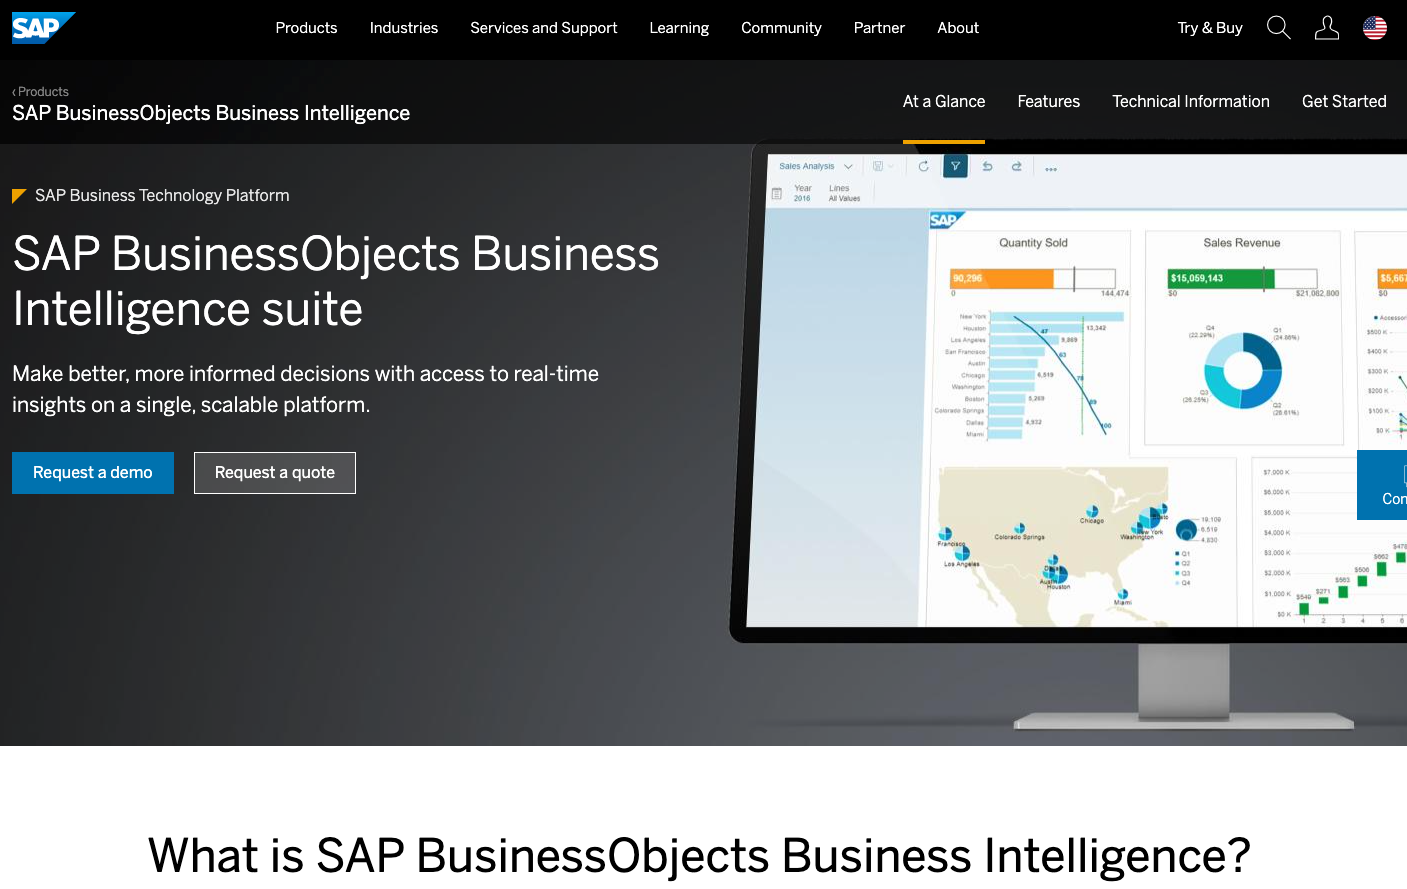
SAP BusinessObjects allows less-technical users to analyze, visualize, and report on their data, all while seamlessly integrating to the rest of the SAP suite.
With it, users can access AI and machine learning technology, and use them for data modeling and visualization, enhanced reporting, and dashboarding. The tool also allows users to access predictive forecasting features to gain deeper insight into their data.
However, although the platform has lowered its pricing, the cost of the solution, particularly when getting platform licenses, can still be prohibitive. That’s why this tool is better for users who are already SAP customers and can benefit from an AI data tool that works along with the other SAP tools they’re already using.
Final Thoughts
Wrapping Things Up
AI data analysis uses machine learning algorithms to monitor and analyze huge amounts of data, automating time-consuming work normally done by data analysts. AI and machine learning now transform data analytics by offering levels of speed, scale, and granularity that are humanly impossible and were previously unimaginable.
Another advantage of using AI data analysis is that, unlike human data analysts, AI algorithms aren’t handicapped by pre-existing assumptions and biases. AI analytics can analyze vast quantities of data and provide a completely objective analysis. In addition, machine learning algorithms can respond to business changes as soon as they occur.
AI tools can help you analyze data deeper than ever before. You can use them to get the insights you’re looking for, find trends and patterns, and make better data-driven decisions. With AI being more affordable and accessible to users, it’s better to adopt it sooner rather than later.
Get started today by dropping your first spreadsheet into Polymer, and see how easy it is to analyze your data with the help of Polymer’s powerful AI.
Sources
https://www.polymersearch.com/blog/the-best-10-ai-tools-to-analyze-data